Visualizing Complexity Science Workshop 2024
This immersive workshop challenges you to become a part of a team dedicated to visualizing the results of complexity science research.
Date: Mon, 26 Aug - Fri, 30 Aug, 2024
Location: Complexity Science Hub, Vienna, Austria
Participation fee: €300
For those facing financial barriers, scholarships are available. Learn more in our FAQ section.
Hosted by
Liuhuaying Yang
Data Visualization Practitioner
Paul Kahn
Information Designer & Author
Guest speakers
Martin Krzywinski
Scientist & Scientific Graphic Designer
Darjan Hil
Information Designer & Educator & Author
Katy Börner
Distinguished Professor & Mapping Science Exhibit Curator
Irene de la Torre Arenas
Journalist & Data Viz Designer at Financial Times
Guest scientists
Elma Dervic
Postdoctoral Fellow
Overview
Visualizing Complexity Science Workshop offers you the opportunity to apply your perspective and strengths to drive the concept and direction of a data visualization project based on real datasets. This is a unique opportunity to experience a form of collaboration generally not available to visualization professionals. Participants will be part of small teams made up of scientific researchers, developers, visualization designers, journalists, and artists engaged in modeling complexity science problems.
The 5-day in-person program, held at Complexity Science Hub in central Vienna, offers a mix of presentations by experts from the international art / science / journalism / visualization communities, group discussions with scientists and peer professionals, and hands-on team working sessions to produce complexity science visualizations.
Who this is for
This workshop is for people from a variety of disciplines and professions, who:
- have data visualization skills at the graduate student or professional level,
- are inspired by the challenge to visualizing scientific research
You will gain
- communication and visualization strategies for data-driven scientific findings,
- the opportunity to engage with our guest speakers,
- inspirations and experience exchange from peers,
- a complex science visualization project to enrich your portfolio.
Visualizing Complexity Science Workshop 2024
Location: Complexity Science Hub, Vienna, Austria
Date: Mon, 26 Aug - Fri, 30 Aug, 2024
Participation fee: €300
For those facing financial barriers, scholarships are available. Learn more in our FAQ section.
Workshop modules
Lectures and discussions
The hosts provide lectures and initiate discussions on the topics of:
-
visualizations in science communication
- What role does visualization play in communicating general scientific research to different audiences?
- How does complexity science differ from other forms of science?
-
communication strategies
- What are the communication challenges specific to complexity science?
- How do scientists and designers collaborate to identify the appropriate information to visualize?
-
visualization strategies
- What are visualization techniques best suited to complexity science models and datasets?
Talks by the guest speakers
Guest speakers from the international art / science / journalism / visualization communities will share their experience and projects, and be available to discuss ideas with workshop participants. Topics will include:
- circos and hive plots (a farewell to hairballs)
- the modular information design system
- mapping science
- visual stories in journalism
Hands-on projects
Researchers from Complexity Science Hub will introduce their projects and datasets to the workshop. Participants will be grouped into teams and select the complexity science visualization project of their choice. Projects will include
- ideation and exploration
- Q&A with Complexity Science Hub researchers
- blue-print presentations and feedback
- final presentations and critique.
Complexity Science Hub researchers will participate in feedback for each team’s final presentation.
What is complexity science?
Complexity science studies systems characterized by many components and their surrounding environment that interact in multiple ways. Research focuses on networks of interactions, complex dynamical processes, and advanced mathematical and computational modeling. Models reveal how these systems are structured and change with time.
To become familiar with Complexity Science projects, look at these examples from the Complexity Science Hub::
Know about instructors
Paul Kahn’s engagement with visualization of large knowledge structures began with hypertext research projects in the 1980s and continued with the development of diagram techniques for describing information architecture. He began teaching Information Design History at Northeastern University’s Information Design & Data Visualization program in 2015. Paul created the first agency in France focused on information architecture, preceded by a decade leading Dynamic Diagrams in Providence RI, and led UX projects as Experience Design Director at Mad*Pow. During and after the pandemic, he developed and wrote about the Covid-19 Online Visualization Collection (COVIC). His essays about information design and data visualization appear in Nightingale and EYE Magazine.
Liuhuaying Yang is a data visualization researcher at Complexity Science Hub. Her expertise is in design and front-end development of interactive data visualizations on the interface of academic research and applications. She has worked with the Massachusetts Bay Transportation Agency, the MIT Senseable City Lab and SMART Future Mobility in Singapore as a data visualization specialist, and SPH Lianhe Zaobao in Singapore as a data visualization designer for interactive data journalism projects. Her work has been awarded the first prize in the 2019 TRB Innovations in Transit Performance Measurement Challenge and recently won first place in the interactive category of the World Dataviz Prize 2023.
Guest speakers
Martin Krzywinski creates visuals with analytical clarity and artistic dimensions. In 1999, he built the Genome Sciences Center’s computing systems, and later invented port knocking and optimized keyboard layouts that spawned a Brazilian fashion line. He has an affinity for parody and tragedy, and loves rabbit holes.
He created Circos (a community standard) and hive plots (a farewell to hairballs). He is triggered by pie charts and slipshod data visualization. His information graphics have appeared in the New York Times, Wired, and Scientific American, as well as on covers of books and scientific journals such as Science, Nature, and PNAS. He is a co-author of the Nature Methods Points of Significance and Points of View columns. He teaches how to design scientific figures and scientific posters. His method is critique by redesign.
He has made maps of nothing, shot fashion photography, and found poems in spam. Every year, he makes Pi Day art. He has told musical stories about digits of π, and videos of infinity and higher dimensions. He loves typography and runs Hitchmas. He is a former owner of Alex, the world’s most popular rat.
Darjan Hil is a European information designer, data visualization educator, and book author based in Basel, Switzerland. He co-founded Superdot with Nicole Lachenmeier and co-authored Visualizing Complexity: the Modular Information Design Handbook. Darjan is the initiator of the well known international event series called On Data And Design and is acclaimed for his expertise in making complex issues accessible and understandable through his innovative diagram types. His work spans a diverse range of domains including data visualization, data storytelling, knowledge mapping, information architecture, and digitalization strategies. Focused on developing both physical and digital experiences, he enhances human understanding and engagement with data.
Katy Börner is the Victor H. Yngve Distinguished Professor of Engineering and Information Science in the Departments of Intelligent Systems Engineering and Information Science, Luddy School of Informatics, Computing, and Engineering; core faculty of the Cognitive Science Program; and founding director of the Cyberinfrastructure for Network Science Center —all at Indiana University in Bloomington, Indiana.
Börner became a Fellow of the American Association for the Advancement of Science (AAAS) in 2012, a Humboldt Research Fellow in 2017, and an Association for Computing Machinery (ACM) Fellow in 2018. Since 2005, she serves as a curator of the international Places & Spaces: Mapping Science exhibit.
Börner’s research focuses on the development of data analysis and visualization techniques for information access, understanding, and management. She is particularly interested in the formalization, measurement, and systematic improvement of people’s data visualization literacy; the study of the structure and evolution of scientific disciplines; the construction and usage of a human reference atlas; and the development of cyberinfrastructures for large-scale scientific collaboration and computation.
Irene de la Torre is a journalist and data visualization designer currently working in the Visual Storytelling team at the Financial Times. Before joining the FT, Irene served as a visualization lead at UCB Biopharma. Her experience also includes roles as a data designer within the Visual Journalism team at BBC News and as a data visualization specialist at the MIT SENSEable City Lab. During her time at MIT, she also taught undergraduate and graduate students data visualization for the School of Architecture.
Irene earned her Master of Fine Arts in Information Design and Visualization from Northeastern University, and holds a Bachelor’s degree in Journalism from Carlos III University as well as a Bachelor’s degree in Advertising from Rey Juan Carlos University. Her thesis on the implementation of animations in data visualizations earned her an Information is Beautiful Award in 2017. Her academic journey in the United States was made possible through the support of the 'La Caixa' Foundation fellowship for postgraduate studies in North America.
Some of her work at the Financial Times and BBC News has received recognition at prestigious events such as the WAN-IFRA European Digital Media Awards and the Data Journalism SIGMA Awards.
Guest scientists
The leading Complexity Science Hub researchers we invited for hands-on projects module.
Elma Dervic is a postdoctoral fellow at the Complexity Science Hub and the Medical University of Vienna. She completed her PhD at CSH and the Medical University of Vienna in January 2023. She also holds bachelor's and master's degrees in electrical engineering from the University of Montenegro. Formerly a junior researcher at BIO-ICT, she co-founded BeeAnd.me, an IoT startup supporting beekeepers. She is known as a 3-time “share positive impact” TEDx speaker. Her research spans machine learning, network science, and data science, with current projects on medical data and supply chain risk analysis.
Working with our scientists
The venue for this workshop is at Complexity Science Hub in Vienna. CSH is located in the Josefstadt district, a short distance from the city center, housed in Palais Strozzi built in 1699–1702.
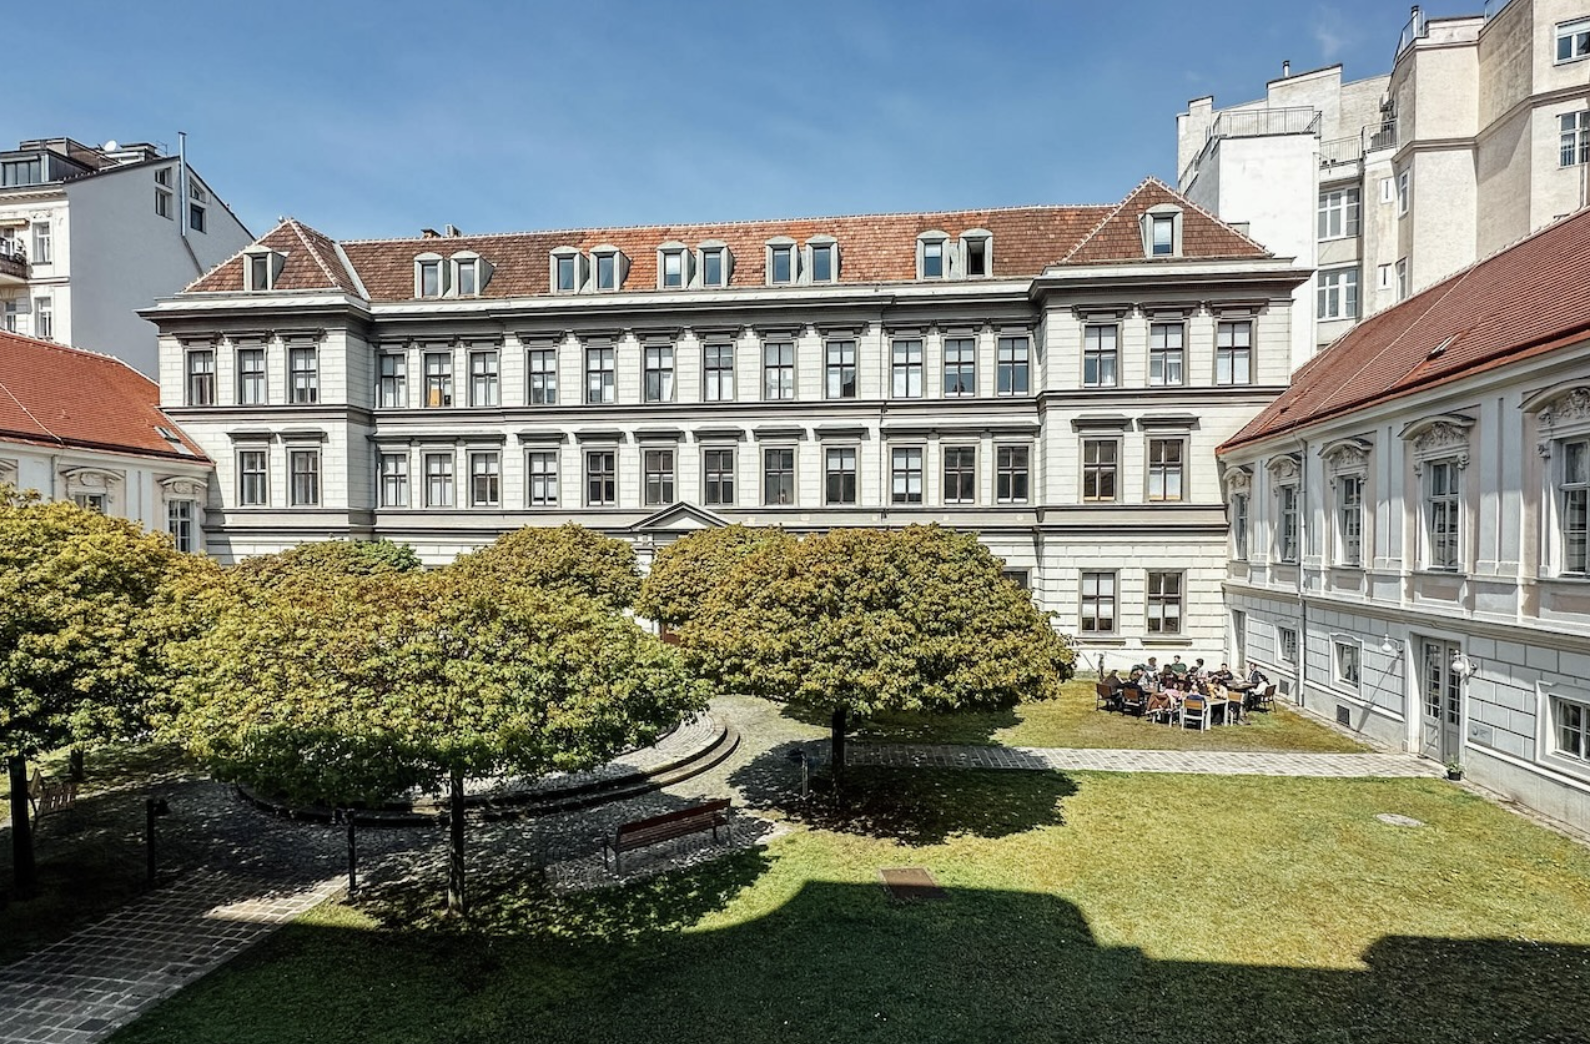
Complexity Science Hub
Garden in Palais Strozzi