Visualizing Complexity Science Workshop 2023
This immersive workshop challenges you to become a part of a team dedicated to visualizing the results of complexity science research.
Date: Mon, 28 Aug - Fri, 1 Sept, 2023
Location: Complexity Science Hub, Vienna, Austria
Participation fee: €200
hosted by
Liuhuaying Yang
Data Visualization Practitioner & Researcher
Paul Kahn
Information Designer & Author
Guest speakers
Jen Christiansen
Senior graphics editor at Scientific American
Samuel Huron
Information designer & Associate professor
Meng Wei
Head of Caixin VisLab
Dirk Brockmann
Professor at Humboldt-University
Robin Meier Wiratunga
Artist & composer
Guy Amichay
Postdoctoral Fellow
Alberto Pino
Artist
Guest scientists
Eddie Lee
Postdoctoral Fellow
Dániel Kondor
Postdoctoral Fellow
overview
Visualizing Complexity Science Workshop brings together multiple perspectives in information design and data visualization to create complexity science visualizations. Teams will combine researchers together with data visualization designers, data journalists, and data artists engaged in advanced visualization projects. The 5-day program is designed to be diverse, creative and inspiring, offering a mix of lectures by the hosts, invited guest speakers from the international data journalism and visualization community, group discussions, and hands-on working sessions engaging with complexity science research datasets.
who this is for
This workshop is for people from a variety of disciplines and professions, who:
- are professionals or graduate student with data visualization skills,
- have experience and/or interest in visualizing scientific research
you will gain
- communication and visualization strategies for data-driven scientific findings,
- the opportunity to engage with our guest speakers,
- inspirations and experience exchange from peers,
- a complex science visualization project to enrich your portfolio.
Visualizing Complexity Science Workshop 2023
Location: Complexity Science Hub, Vienna, Austria
Date: Mon, 28 Aug - Fri, 1 Sept, 2023
Participation Fee: €200
Workshop modules
Module 1: Lectures and discussions
The hosts provide lectures and initiate discussions on the topics of:
-
visualizations in science communication
- What role does visualization play in communicating general scientific research to different audiences?
- How does complexity science differ from other forms of science?
-
communication strategies
- What are the communication challenges specific to complexity science?
- How do scientists and designers collaborate to identify the appropriate information to visualize?
-
visualization strategies
- What are visualization techniques best suited to complexity science models and datasets?
Module 2: Talks by the guest speakers
The invited guest speakers from the international data journalism and visualization community share their experience and projects. Topics will include:
- The role of data visualization and interactive design in news storytelling in China
- strategies for conveying complex information to broad audiences with diagrams and visualizations
- interactive explorable explanations of complexity science models
- physical design and craft with data
- Art & Science collaboration on art piece Synchronicity
- data printing: artworks inspired by NetSci 2023 keynote papers
Module 3: Hands-on projects
Engaged in one or more complexity science visualization projects that we provide. The leading Complexity Science Hub researchers will introduce their projects and datasets to the workshop. Projects will include
- formation of teams
- ideation and exploration
- blue-print presentations and feedback
- development of final presentations.
Complexity Science Hub researchers will participate in feedback for each team’s final presentation.
Program schedule
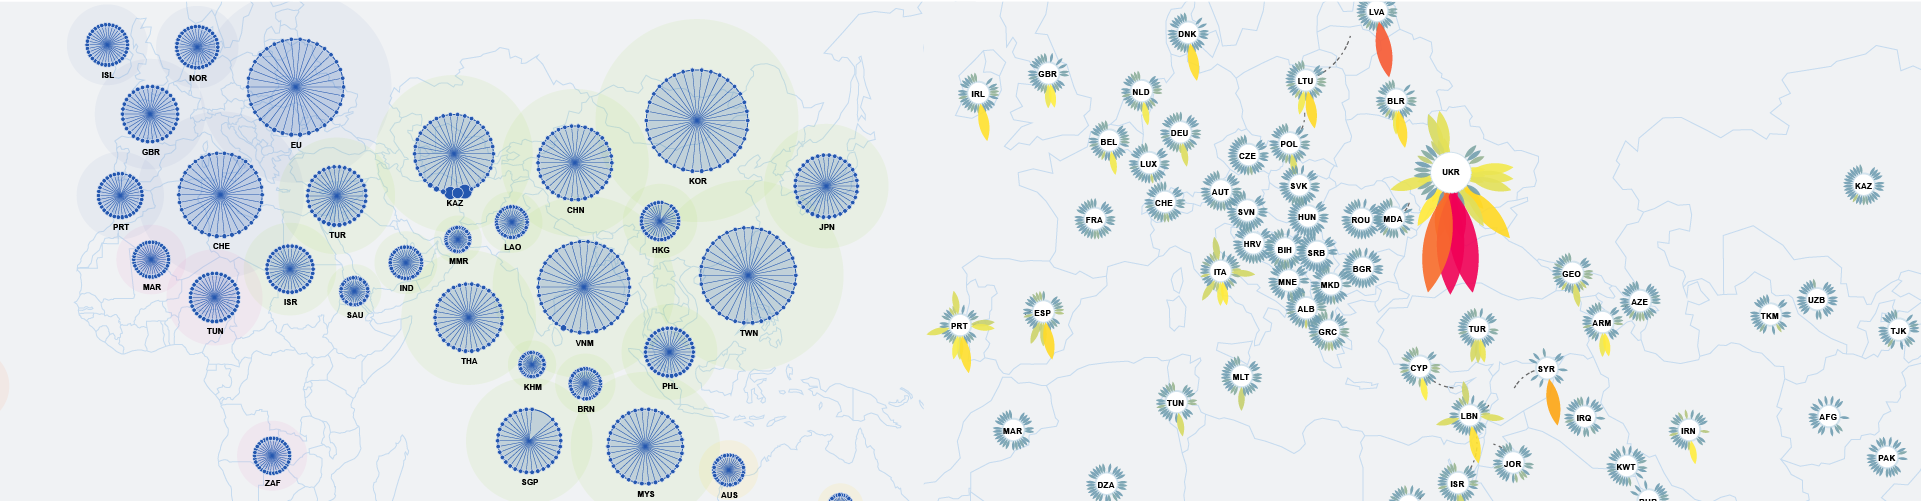
What is complexity science?
Complexity science studies systems characterized by many components and their surrounding environment that interact in multiple ways. Research focuses on networks of interactions, complex dynamical processes, and advanced mathematical and computational modeling. Models reveal how these systems are structured and change with time.
To become familiar with Complexity Science projects, look at these examples from the Complexity Science Hub::
Know about instructors
Paul Kahn’s engagement with visualization of large knowledge structures began with hypertext research projects in the 1980s and continued with the development of diagram techniques for describing information architecture. He specializes in solving large information problems, shaping and designing collections of digital information to improve user experience. He began teaching Information Design History at Northeastern University’s Information Design & Data Visualization program in 2015. Paul created the first agency in France focused on information architecture, preceded by a decade leading Dynamic Diagrams in Providence RI. He served as Experience Design Director at Mad*Pow and now devotes himself to teaching and writing in France. Currently he directs the Covid-19 Online Visualization Collection (COVIC), and writes about insights from the thousands of visualizations created during the pandemic.
Liuhuaying Yang is a data visualization researcher at Complexity Science Hub. Her expertise is in design and front-end development of interactive data visualizations on the interface of academic research and applications. She has worked with the Massachusetts Bay Transportation Agency, the MIT Senseable City Lab and SMART Future Mobility in Singapore as a data visualization specialist, and SPH Lianhe Zaobao in Singapore as a data visualization designer for interactive data journalism projects. Her work has been awarded the first prize in the 2019 TRB Innovations in Transit Performance Measurement Challenge and recently won first place in the interactive category of the World Dataviz Prize 2023.
Guest speakers
Jen Christiansen is author of Building Science Graphics: An Illustrated Guide to Communicating Science through Diagrams and Visualizations (CRC Press) and a senior graphics editor at Scientific American, where she art directs and produces illustrated explanatory diagrams and data visualizations. She completed undergraduate studies in geology and art at Smith College, then happily merged the two disciplines in the scientific illustration graduate program at the University of California, Santa Cruz. She began her publishing career in New York at Scientific American in 1996, moved to Washington DC to join the art department of National Geographic, spent four years as a freelance science communicator, then returned to Scientific American in 2007. She writes and presents on topics ranging from reconciling her love for art and science, to her quest to learn more about the pulsar chart on Joy Division’s Unknown Pleasures album cover.
Dr. Samuel Huron is an information designer and associate professor in the design of information technologies inside the Social and Economical Science department of Télécom Paris at the Institut Polytechnique de Paris and part of the CNRS Institut Interdisciplinaire de l’Innovation.
He recently co-edited the book Making with Data: Physical Design and Craft in a Data-Driven World. He previously worked as the lead designer of the research institute of the Pompidou Center. His research address how humans create visual and physical representations of abstract information to think, collaborate, learn, analyze, explore, and design new data representations, systems, and information artefacts. His approach is grounded in fifteen years of experience in interactive media industries, where he designed systems with a broad range of civic, cultural, and corporate clients. Before academic research, he was engaged in new media art and worked with video art labels on an art installation, video mixing, and live performances. He presented and performed some of these works in thirteen shows or exhibitions in various places, including art museums, parties, and festivals. For his Ph.D. on Constructive Visualization, he was awarded the “Best doctoral dissertation award” from IEEE VGTC Pioneer Group.
Meng Wei is the head of the Caixin Vislab in China, where she led the team won Global Editors Network (GEN) 2018 Data Journalism Award for Best Large Data Journalism Team, a first for a Chinese media outlet. Founded in 2013, Caixin VisLab is one of the earliest teams in China to combine data visualization with news reporting, and it has won Society of Publishers in Asia (SOPA) Awards for numerous projects.
As a data visualization developer and designer, she is dedicated to storytelling news to the young generation via data visualization and interactive design. Her work After the Flood: Never Let Bygones Be Bygones (2016) has been mentioned in the SOPA visualization panel; a 3D project Emigrate Far Away (2017) has been used as example in data journalism course in Chinese universities; Where Can You Go in Four Hours on the Hight-speed Trains? (2018) was nominated for GEN’s best visualization project of the year; In recent years she explored more possibilities to build emotional contacts with readers via visualization. She has been a judge member of China Data Content Conference since 2020. She is also a mother of two boys and keeps updating a visual journal (with data visualization!) about children and self-growth.
Dirk Brockmann is Professor at the Institute of Biology at Humboldt-University of Berlin. Between 2007-2013 he was Professor for Applied Mathematics at Northwestern University. At Northwestern University he was on the faculty of Northwestern’s Institute on Complex Systems where he still holds an external faculty position. A theoretical physicist by training, his research focuses on complex systems at the interface of physics, life sciences and social sciences. Dirk Brockmann is member of the Institute of Theoretical Biology as well as the Integrated Research Institute for the Life-Sciences at Humboldt University of Berlin. He is also head of the project group Computational Epidemiology at the Robert Koch-Institute, Germany’s federal public health institute.
Artist and composer, Robin Meier Wiratunga tries to understand the emergence of patterns and thoughts, be it for people, insects, flocks, algorithms, rivers... With a bag of tricks from sound, science and sorcery he composes thinking tools he never quite manages to master. Referred to as “Artist of the future” (le Monde), “Maestro of the swarm” (Nature) or simply “pathetic” (Vimeo) his investigations have been conducted internationally, with partners including Palais de Tokyo, Centre Pompidou, Shanghai Biennale and Colomboscope Sri Lanka amongst others. Meier Wiratunga is a collaborator at the IRCAM Centre Pompidou in Paris. He teaches Sound Arts at the HKB Academy of the Arts in Bern and is a fellow of the Istituto Svizzero in Rome.
His work Synchronicity, inspired by Steven Strogatz’ work on coupled oscillators, led to collaboration between Robin and scientist Guy Amichay studying firefly synchronization in Thailand, visualisation of models developed by Amichay and finally a video installation exhibited at EPFL Pavilions in Lausanne.
Guy Amichay is a Postdoctoral Fellow at Northwestern University in the Engineering Sciences & Applied Mathematics department as well as Northwestern Institute on Complex Systems (NICO), working with Daniel Abrams. He is also a guest researcher at the Complexity Science Hub, in the Network Inequality group led by Fariba Karimi.
He is mostly interested in self-organization—how systems manage to become ordered with no obvious leader or conductor. His current work is on synchronization (coupled oscillators), focusing on different systems such as firefly swarms flashing in unison or groups of crabs waving their claws in sync. As part of his work on sync he is collaborating with artist Robin Meier, their work currently exhibited at EPFL Pavilions in Lausanne, Switzerland. Aside to this, he is also working on science of science (on the formation of collaborations) and association football (soccer) collective movement analysis.
Alberto Pino has been honing his artistic skills at the Real Casa de la Moneda in Madrid. The juxtaposition of industry and art within this institution has sparked Alberto's interest in the forms, elements, and language of industry. While his education primarily focuses on form rather than function, it enables him to interpret utilitarian objects from a purely aesthetic standpoint.
As a part of the NetSci exhibition, he has recently crafted a series of artworks dedicated to the keynote speakers, drawing inspiration from their papers presented at NetSci 2023. The process of transfiguring these visual representations from their digital origin to the tangible beauty of engravings appears almost magical. Despite this metamorphosis, the engravings retain a profound connection to their original meaning, much like an umbilical cord. For the initiated, the images become an invitation to rediscover the diagrammatic as beauty. For those ignorant, they offer a gateway from beauty to scientific knowledge.
Guest scientists
The leading Complexity Science Hub researchers we invited for hands-on projects module.
Eddie Lee studies the small and large living patterns around us from the biology of neural tissue to the ecology of forests, the dynamics of armed conflict, and the processes of innovation and obsolescence in society. He is fascinated by how we paint those patterns on the shared canvas of mathematics and what the resulting similarities between the mathematical representations reveal about them. Do similarities reflect analogous function, universal dynamics, or are they (simply) artifacts of our representation? His work develops the mathematics of such systems and aims to answer these overarching questions.
He is an Austrian Science Fund ESPRIT Fellow at the Complexity Science Hub and formerly a Program Postdoctoral Fellow at the Santa Fe Institute. He has a PhD in Theoretical Physics from Cornell University—where he received a National Science Foundation Graduate Research Fellowship—and a BA in Physics from Princeton University. He has invited to policy panels for the science of violence (Santa Fe Council on International Relations) and for the physics of the 2021 Nobel Prize (Santa Fe Institute).
Dániel Kondor joined the Complexity Science Hub as a PostDoc in May 2021. Before that, he worked at the Senseable City Lab at MIT and SMART FM in Singapore. He earned a PhD in physics with a focus on network and data science from the Eötvös Loránd University in Budapest in 2015. Dániel has worked with diverse topics that focus on the analysis of large-scale geographically embedded phenomena, including the study of human mobility in various contexts. His current research focuses on large-scale, agent-based models of interactions among historical societies. His research interests include data-driven and agent-based modeling of complex social, economical, and technological phenomena.
Working with our scientists
The venue for this workshop is at Complexity Science Hub Vienna, located in the Palais Strozzi built in 1699–1702.
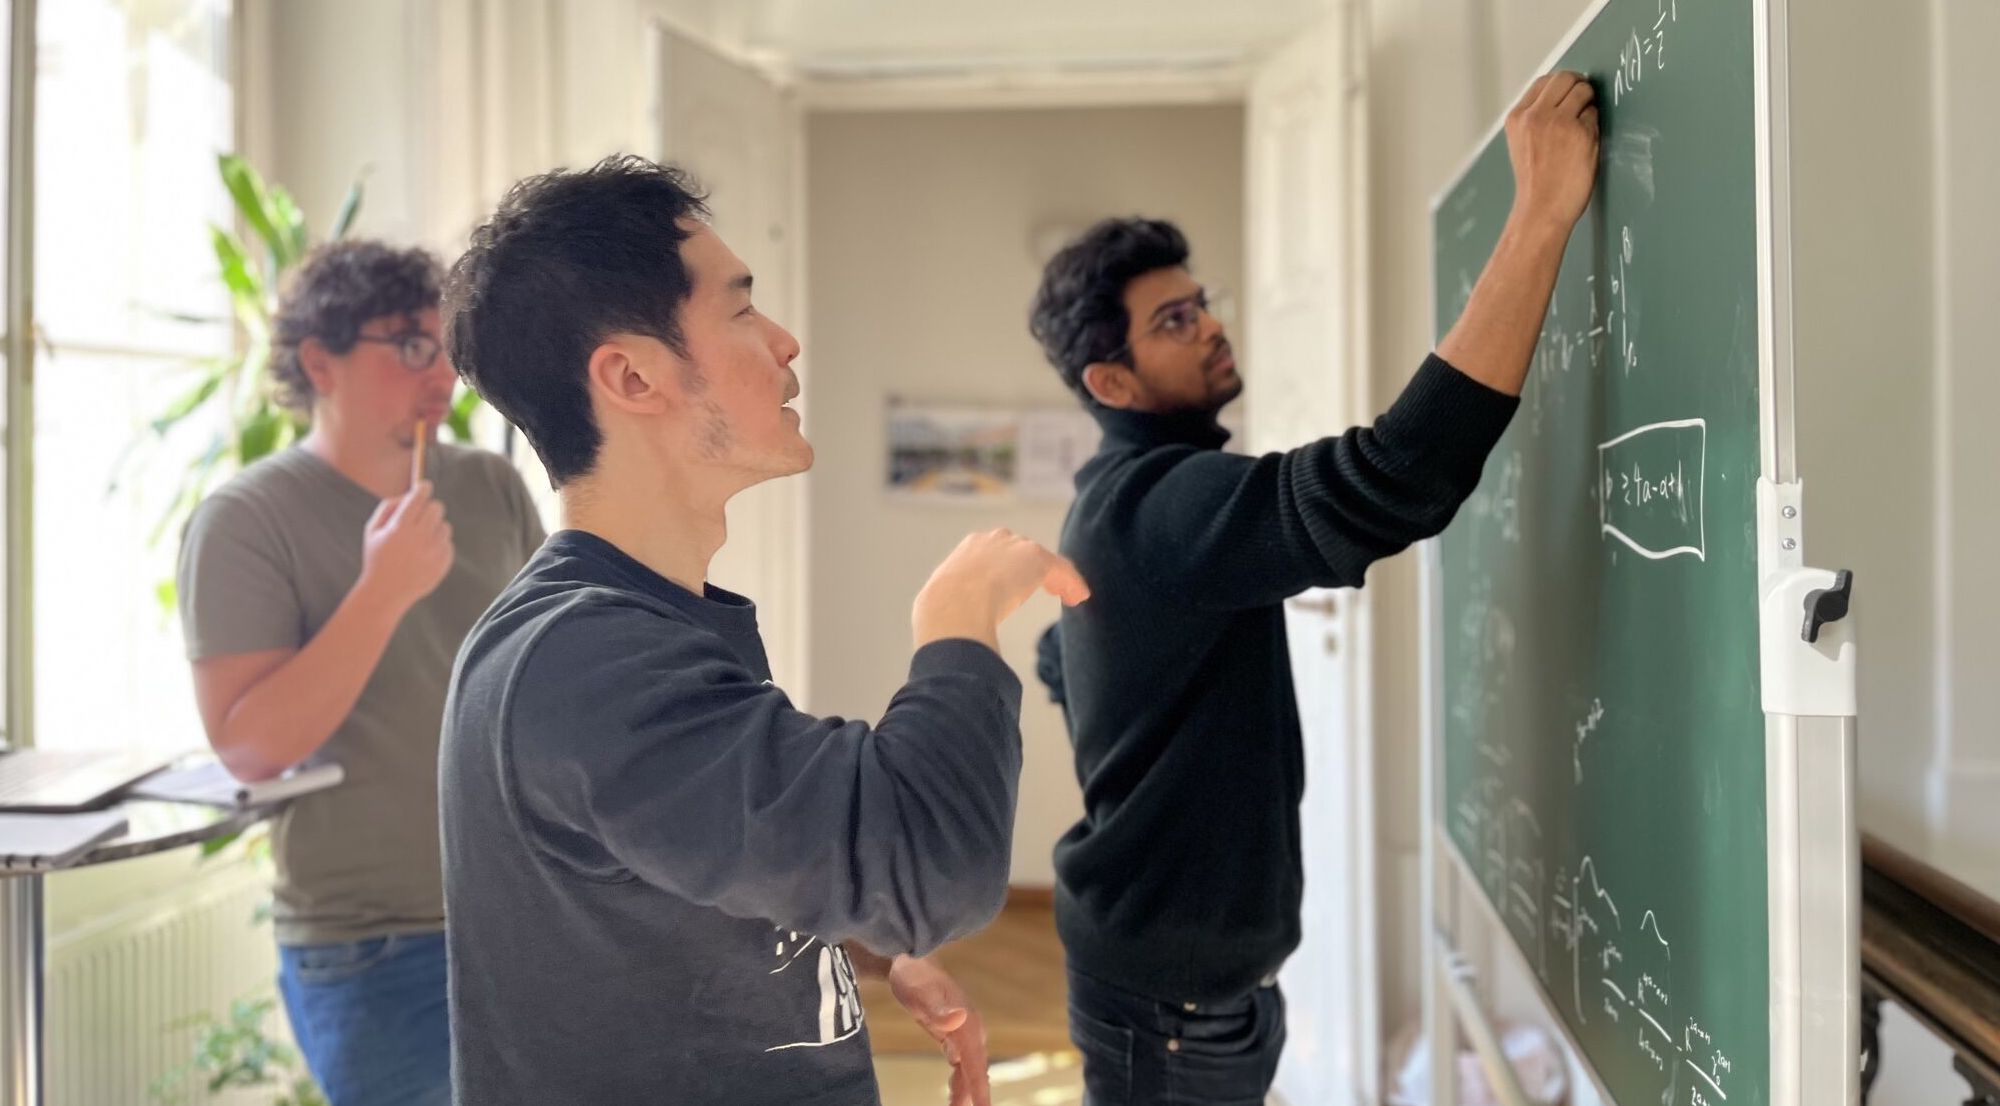
Working with Eddie Lee
A day in the life of postdoctoral fellow Eddie and his team.
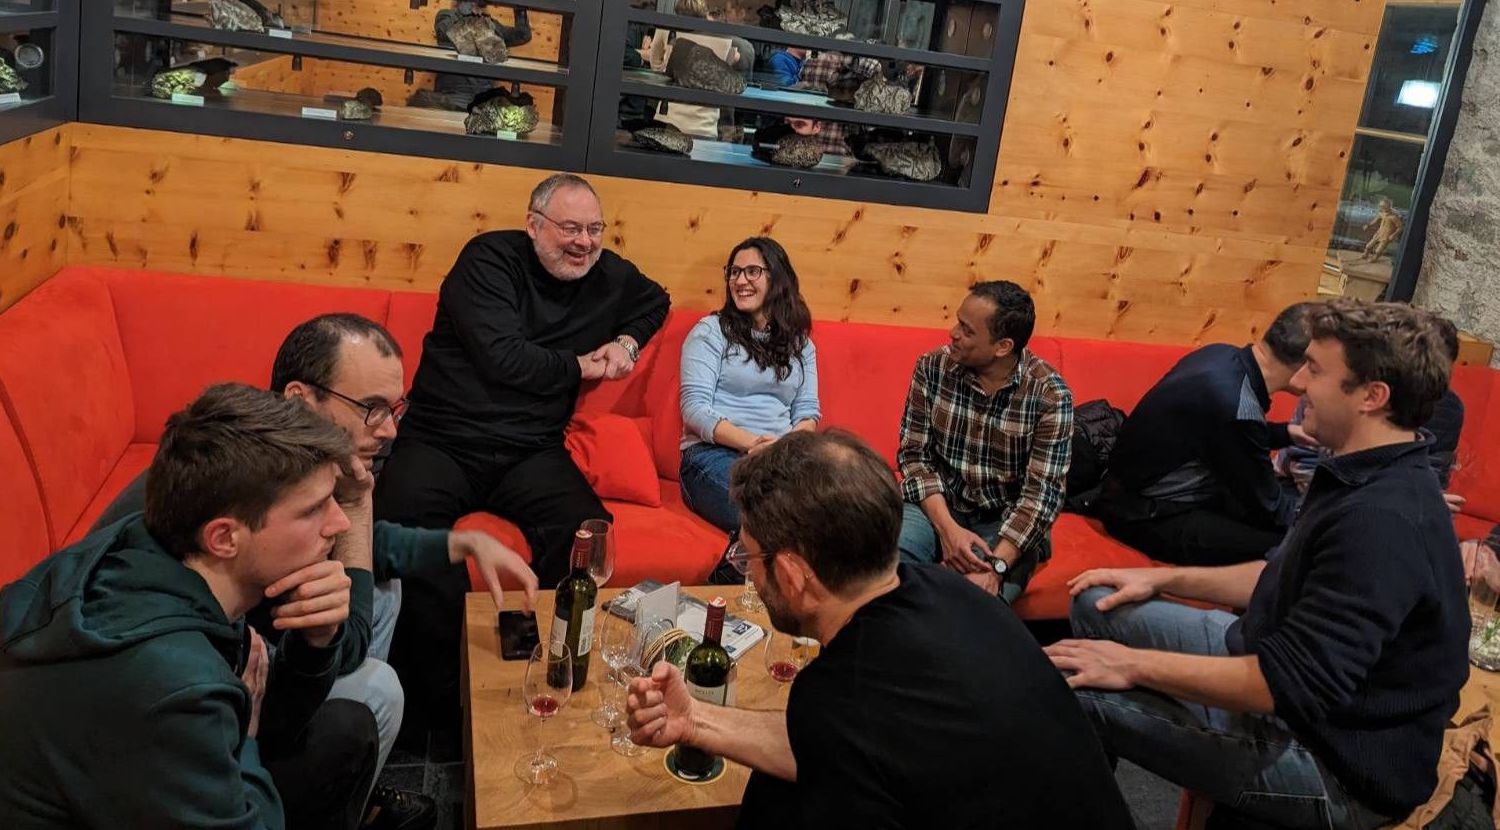
Working with Dániel Kondor
The Winter School workshop held by Dániel's research group in the Austrian Alps earlier this year.